![]() The last time I wrote about the usefulness of shark puke, I discussed a few of the less obvious uses of diet studies on sharks. As apex predators, sharks can sample a wide variety of potential prey species, and diet studies can provide just as much information on those species as the sharks themselves. That said, the main function and justification for sifting through shark vomit is to figure out what kind of predatory impact the sharks have, which lets us know how these predators fit into the ecosystem and adjust fisheries models accordingly, put protections in if the most important prey are declining, or see if the food web needs any “adjusting” (always a popular topic at fishery advisory council meetings). In order to figure this out, scientists need to figure out just how much food a shark needs, and there are some nifty ways of doing this.
The last time I wrote about the usefulness of shark puke, I discussed a few of the less obvious uses of diet studies on sharks. As apex predators, sharks can sample a wide variety of potential prey species, and diet studies can provide just as much information on those species as the sharks themselves. That said, the main function and justification for sifting through shark vomit is to figure out what kind of predatory impact the sharks have, which lets us know how these predators fit into the ecosystem and adjust fisheries models accordingly, put protections in if the most important prey are declining, or see if the food web needs any “adjusting” (always a popular topic at fishery advisory council meetings). In order to figure this out, scientists need to figure out just how much food a shark needs, and there are some nifty ways of doing this.
While diet studies are certainly interesting (to the general public, eating is arguably the most interesting thing that sharks do) and have a number of practical applications, one thing they are not is glamorous. It’s long hours of sifting through stomach contents punctuated by “what the…” moments of finding something unusual in there, followed by attempts to classify prey species that may be pretty well-digested by the time you get to them, followed by a deceptively intimidating amount of stats. What you end up with is an idea of the most common prey items with, if your sample size is large enough, a relatively trustworthy measurement of how much of each prey species was eaten by the sharks you sampled. Congrats, half of the hard part is over.
In order to get practical use out of your data, you need… some more data. Now that you know how much was eaten within your sampling period, you need to know generally how much your sharks need to eat to survive. This is usually expressed as “daily ration” or “annual consumption,” which is a rough estimate of how much food an animal needs within those time frames for a normal healthy lifestyle. These measurements usually expressed either in terms of weight or percent of the animal’s mass, and once you know them they are very easy to just plug into your hard-earned diet data and start estimating say, how many menhaden a sharpnose shark eats in a year.
Olson and Mullen (1986) sum up everything you need to know in one handy equation:
Oh crap, math! Don’t panic. The value “r” is the estimate of food needed per hour (multiply this by 24 for daily ration), which is what you’re trying to find, and W is the average mass of prey species “i” in your data set, which you already have. That big sigma symbol just means you’re adding up the results of the equation once you’ve figured it out for each prey species. “A” is the bugger; it’s an estimate of how fast those prey items are digested, or the “gastric evacuation” for that species. So the ration is basically the amount of food eaten divided by the rate at which it’s digested. Pretty straightforward, right?
If you’re lucky, someone has figured this out for your species already and you can just cite a number, plug it in, publish it, and move on with your life. Unfortunately, estimates of diet needs are one of those “basic science” questions that researchers really went for back in the 60s and 70s and have been assumed correct ever since. This is especially and maddeningly true for sharks, which have the added bonuses of not being easy to study in captivity or get to stay in one place long enough to get enough data. That said, there are some very clever (and, I dare say, potentially fun) ways researchers have used to get these estimates, with varying degrees of expense and equipment required.
Feeding baby hammerheads in a tank. Photo from Monteray Bay Aquarium.
Most of the time, figuring out how long it takes a shark to digest prey involves some variation of keeping it in captivity, feeding it a predetermined amount of food, and getting that food back out after a set amount of time to see how much is left. Hannan (2009) provides a great example of this with North Pacific spiny dogfish; she kept some sharks in captivity, weighed their food before feeding them, then pumped their stomachs (gastric lavage, yeah!) to see how much was left. By using a nonlethal method she was able to sample the same dogfish multiple times, and get around a relatively low sample size. If you have access to an appropriately-sized tank, some fish, and a set of lavage tubes, you could bang out this study in a couple weeks. Bush and Holland (2002) performed a similar procedure with juvenile scalloped hammerheads, keeping them in open-water enclosures rather than tanks. However, they acknowledged that gobies and shrimp, two species showing up often in the diet of the young hammerheads, may be digested at different rates. They simply repeated the procedure with each prey item.
However, it was an old, classic study by Jones and Geen (1977) that showed that it’s possible to estimate daily ration without even having to get the food back. Their study was an absolutely epic assessment of the dietary needs of North Pacific spiny dogfish, and is still cited as a shining example of a truly complete diet study. They used multiple methods to determine the daily dietary needs of their dogfish, and in one they simply fed them. Keeping a known number of dogfish in a netted enclosure, they fed the whole school a predetermined amount of herring every 2-3 days, coming back to check on how much had been eaten. The amount consumed was divided by the number of sharks, then the number of days, and bam: an estimate of daily ration without having to do much more than feed the sharks. They checked this using captive dogfish in tanks as described in the previous paragraph, and the estimates were within the same ballpark.
Given a huge data set, you could also do the mathematical equivalent of just feeding the sharks. Jason Link and his merry band of fisheries statisticians have access to a massive database comprising all the diet data from over 40 years of trawl surveys conducted by NOAA/NMFS, and have developed a series of equations that estimate the dietary needs of the predators in that data set with reasonable accuracy (Link et al. 2002). This blog post would be over twice as long if I went through them all, but they are well explained in that paper (see citations at the bottom of this post).
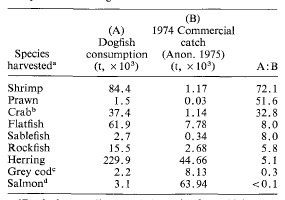
So now you have your diet data and an estimate of how much your sharks should be eating out in the wild. Now you have all the info you need to figure out all kinds of fun ecological stuff. Both Jones and Geen (1977) and Link et al. (2002) were motivated by looking at the impact of spiny dogfish predation on fisheries, so they took their estimates of dogfish predation and compared them to fisheries landings from the same time frame:

Dogfish consumption, fisheries landings, and ratio of potential landings eaten (A:B). From Jones and Geen (1977).

Mean, maximim, and minimum consumption of select species by spiny dogfish and winter skate, compared to 1998 fisheries landings. From Link et al. (2002).
From Jones and Geen (1977), we can see that dogfish predation barely puts a dent in the salmon landings, but that they eat 5.1 times as many herring as are landed by fishermen. Over in the Atlantic, Link et al. (2002) show that predation on cod and flounder species is negligible compared to fisheries landings, but silver hake, mackerel, and herring are eaten at rates comparable to human exploitation. This is very useful info for fisheries managers that directly effects how fish gets to your plate.
In a less-obvious use, Bush and Holland (2002) used their estimates of the dietary needs of scalloped hammerheads to show that young hammerheads are actually consuming less than their ideal daily ration in their nursery area. This raises some interesting questions about the nature of nursery areas; if these hammerheads are not feeding optimally, why stay in the nursery area? This particular nursery may have benefits other than feeding opportunities, such as predator avoidance.
So there’s a (not so) short look at what scientist do to figure out the feeding needs and predatory impact of sharks, and similar methods are used throughout ecology. Feeding studies and determining daily ration are perfect example of basic science that has immediate practical applications. In some circles there is a sense that incoming students and younger scientists are avoiding this kind of work in favor of more “trendy” methods. That said, the need for diet studies is not going away and researchers are getting weary of citing those grand old diet studies, so updating or figuring out a shark’s daily ration is a surefire way to get cited. Diet analysis may not be as flashy as satellite tagging or as “easy” as stable isotopes, but the best way to get at the hard data is still to dig into the puke and the specifics.
Sources Cited:
Bush, A., & Holland, K. (2002). Food limitation in a nursery area: estimates of daily ration in juvenile scalloped hammerheads, Sphyrna lewini
(Griffith and Smith, 1834) in Kane’ohe Bay,O’ahu, Hawai’i Journal of Experimental Marine Biology and Ecology, 278, 157-178
Hannan, K. (2009). Determination of gastric evacuation rate for immature spiny dogfish Biology and Management of Dogfish Sharks, 253-258
Jones, B.C., & Geen, G.H. (1977). Food and Feeding of Spiny Dogfish (squalus acanthias)in British Columbia Waters Journal of the Fisheries Research Board of Canada, 34, 2067-2078
Link, J.S., Garrison, L.P., & Almeida, F.P. (2002). Ecological Interactions between Elasmobranchs and Groundfish
Species on the Northeastern U.S. Continental Shelf. I.
Evaluating Predation North American Journal of Fisheries Management, 22, 550-562
Olson, R., & Mullen, A. (1986). Recent developments for making gastric evacuation and daily ration determinations Environmental Biology of Fishes, 16 (1-3), 183-191 DOI: 10.1007/BF00005170

